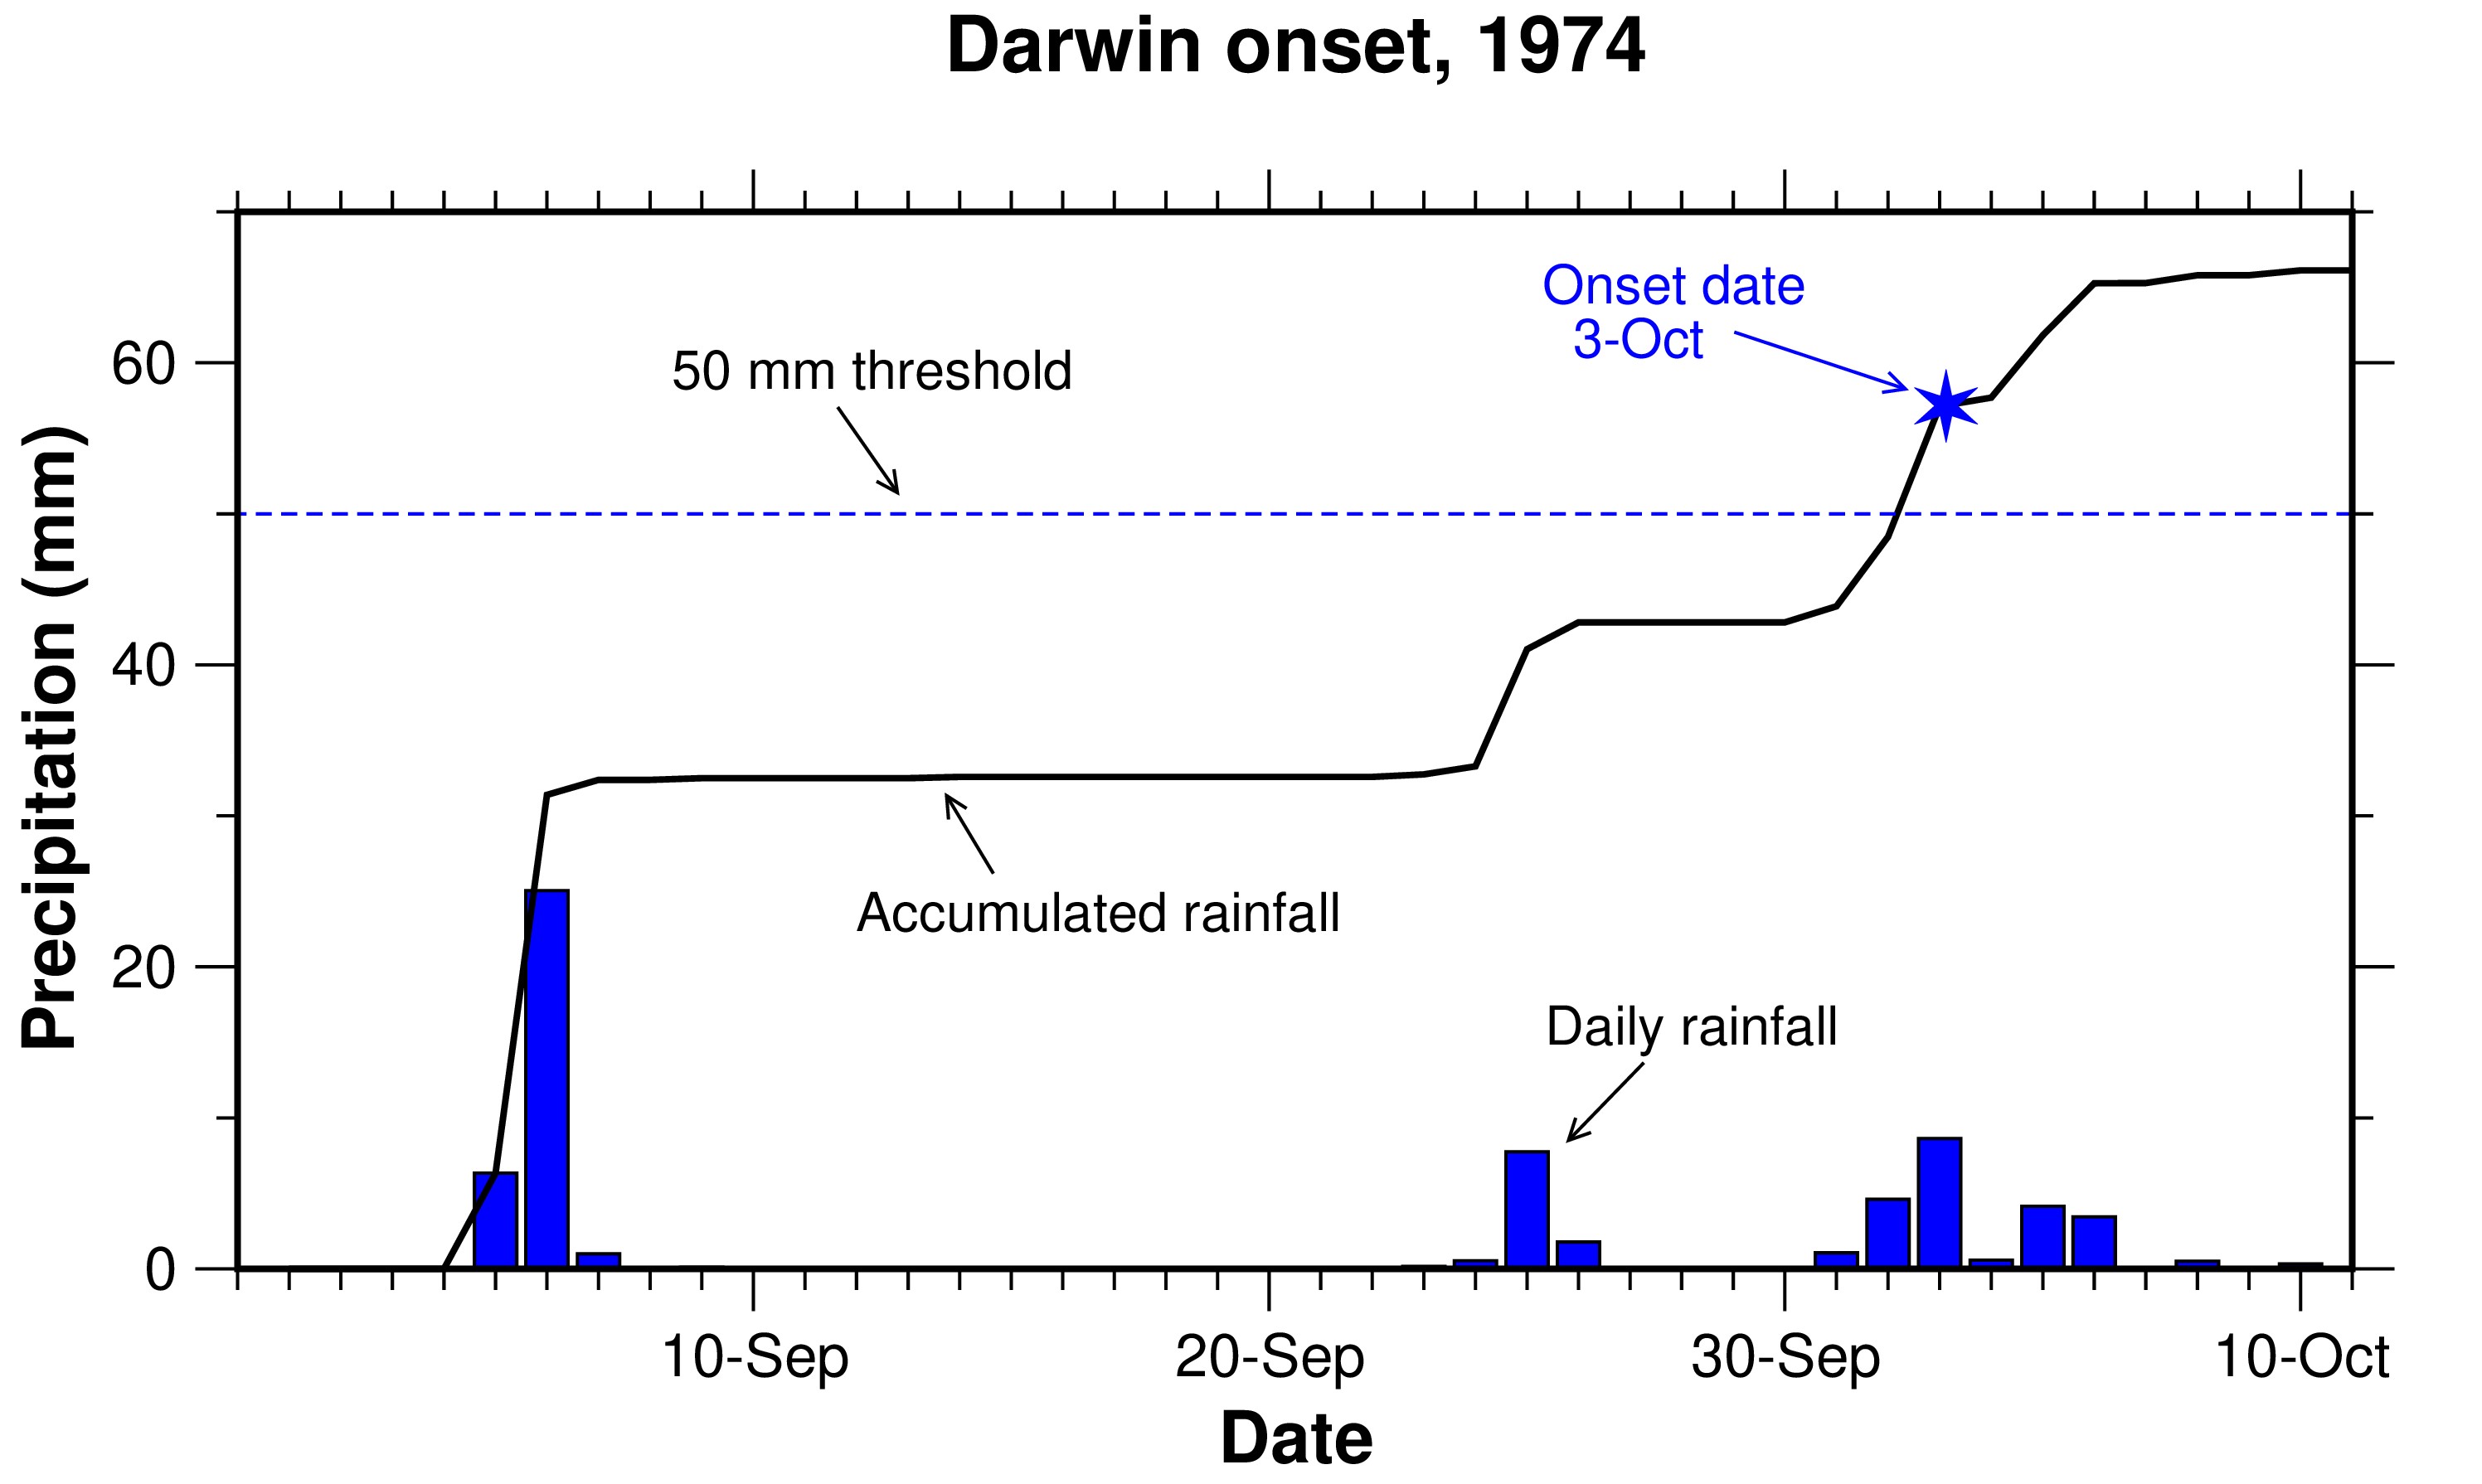

Northern rainfall onset is defined as the date at which an accumulation of 50 mm is reached after the 1st September . This is approximately the amount of rainfall that is required to generate new pasture growth after the dry season, and has been shown to be useful for many agricultural applications. It differs from the northern wet season, which is defined to always start on the 1st October. The method for describing northern rainfall onset is detailed in: Drosdowsky, W., and M.C. Wheeler, 2014, Wea. Forecasting, 29, 150-161.
The example below shows an early October onset date for Darwin in 1974 after three separate rainfall events, while onset occurred between late November and late December in east Arnhem Land.


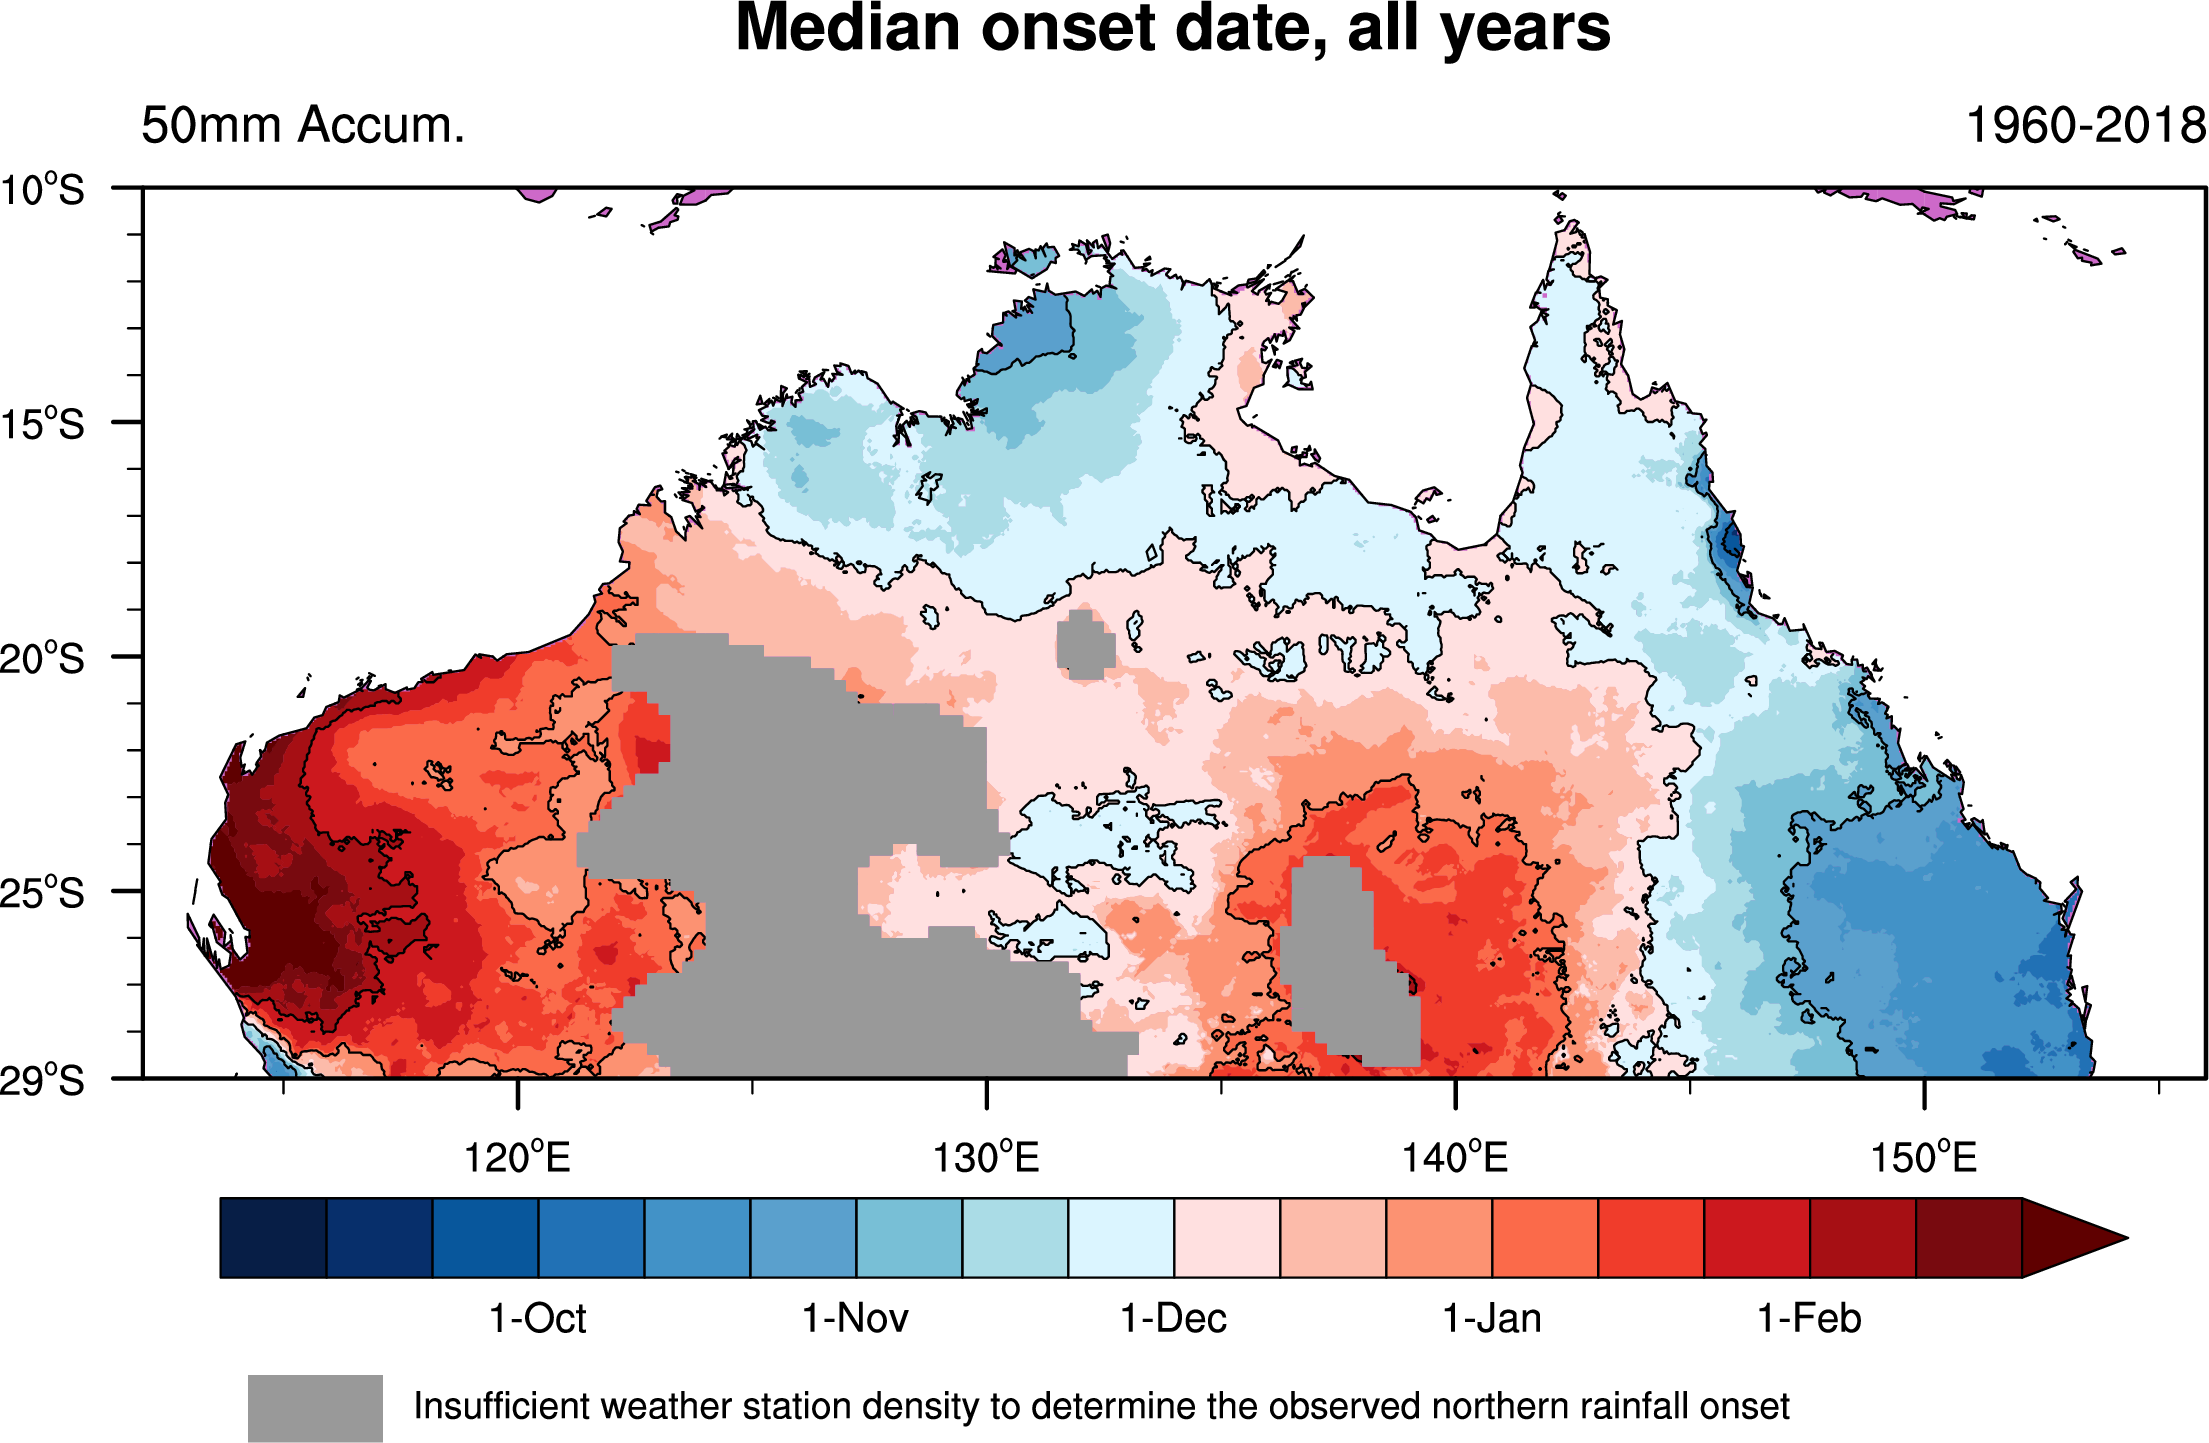
The panel below displays the median onset date based on all years from 1960 to 2018, with the onset appearing around Darwin and Cairns in late October. The median onset occurs progressively later for locations north and east of 18°S/145°E and later for locations further south and west, generally landing on dates before 1st December. During El Niño events (warmer than average eastern equatorial Pacific and cooler than average west Pacific), the onset dates are pushed back into November around Darwin, while Cairns' onset is largely unaffected. During La Niña events (warmer in west Pacific, cooler in east Pacific), onset arrives around early-mid October for Darwin, while along the eastern Qld, onset can occur in late September.
Below, the user can choose four median periods: 1960-2018, 1960-2012, 1981-2018 and 1990-2012, and choose median onset for El Niño, La Niña or neutral years, and apply a 1-2-1 spatial filter, which smooths the 5 km gridded data 50 times. Details on smoothing are provided in: Lo, F., M.C. Wheeler, H. Meinke, and A. Donald, 2007, Mon. Wea. Rev., 135, 3506-3520.
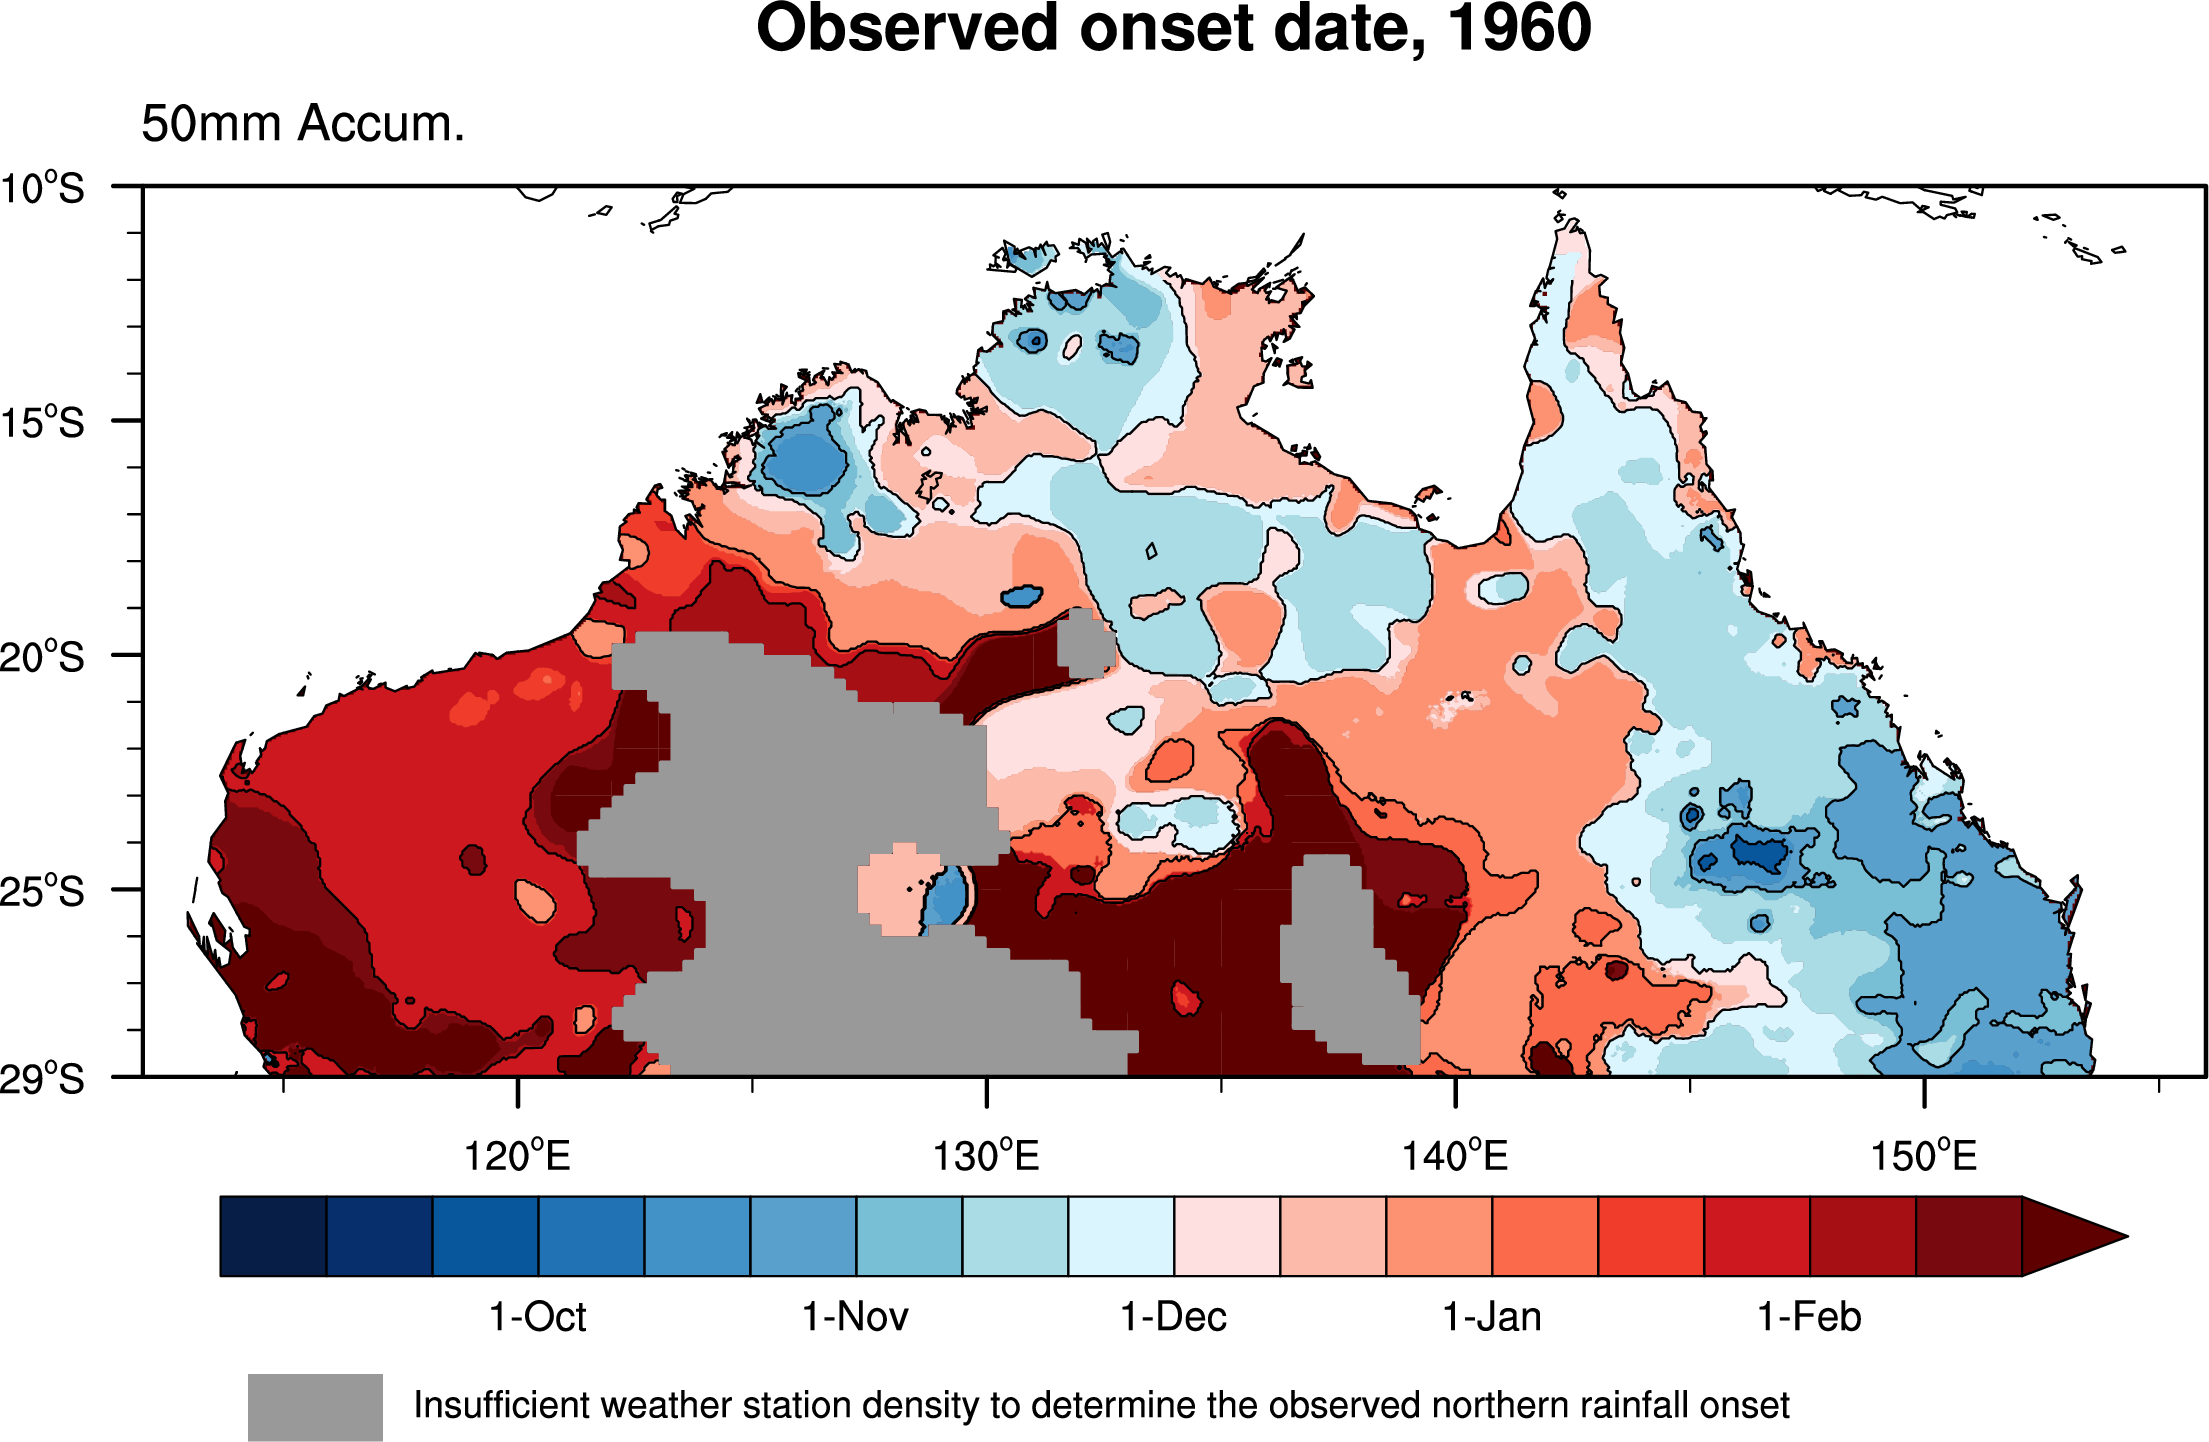
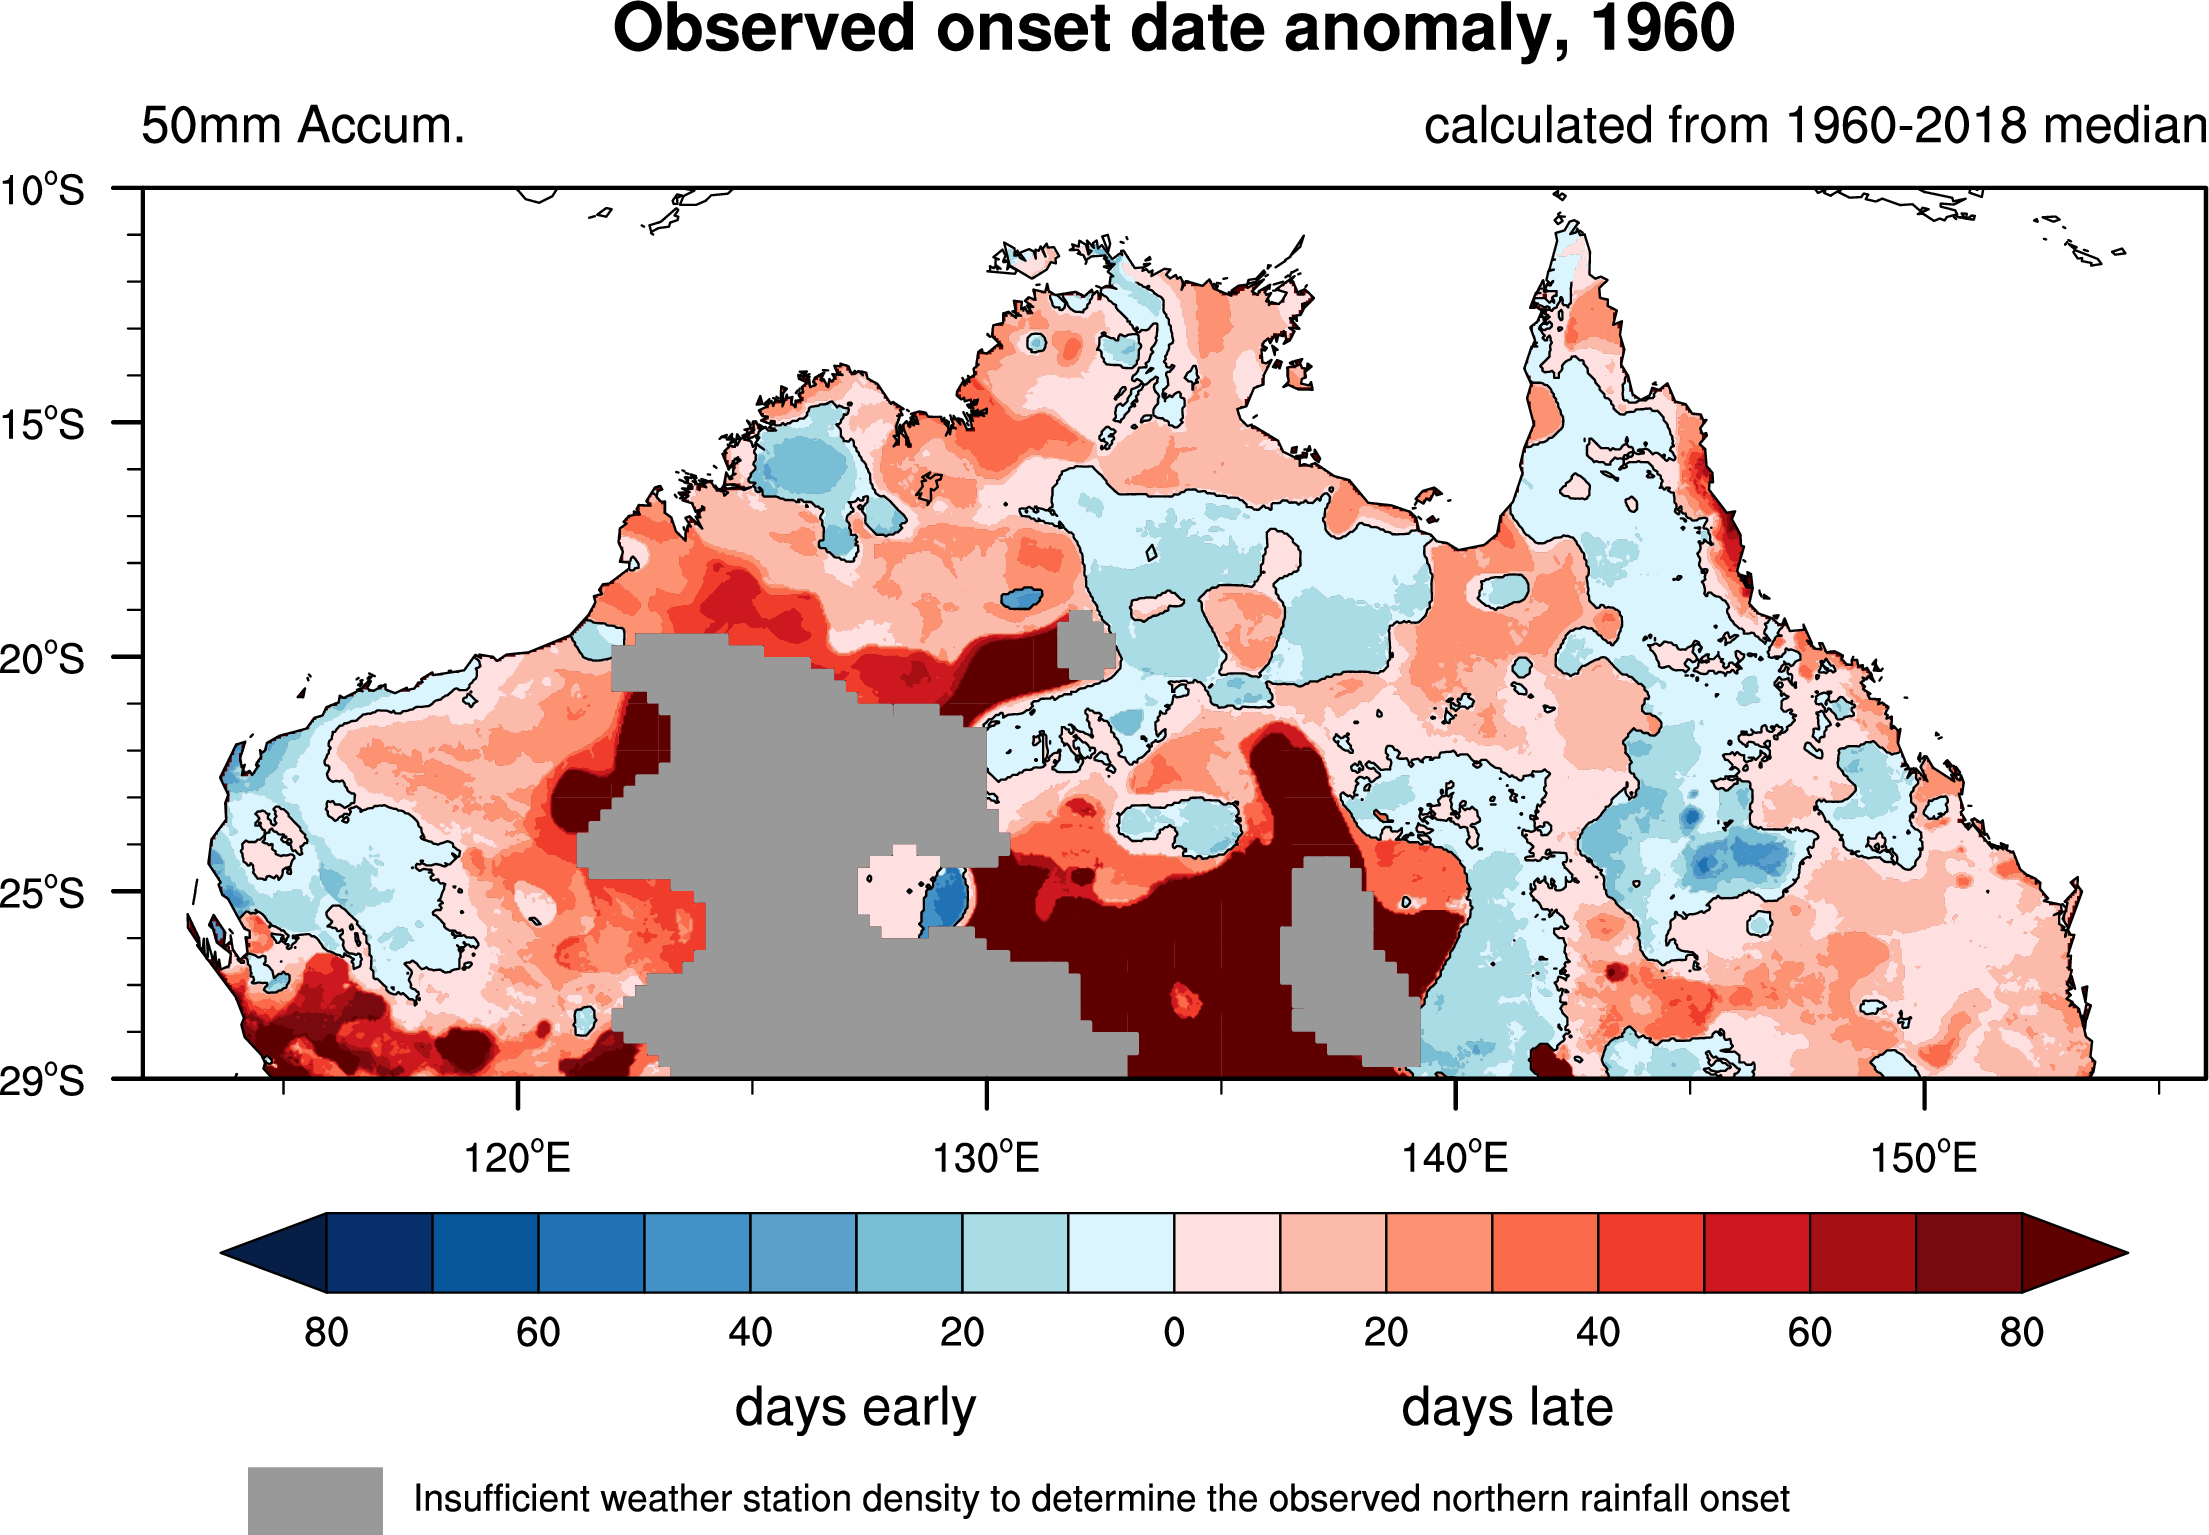
The panels below show the observed onset dates and anomalies for each wet season from 1960 to 2018. The anomalies are referenced to the 1960-2018 median that has been smoothed with a 1-2-1 spatial filter (50x). For the anomalies, blue colours indicate earlier (than median) onset, while red shades indicate later onset.
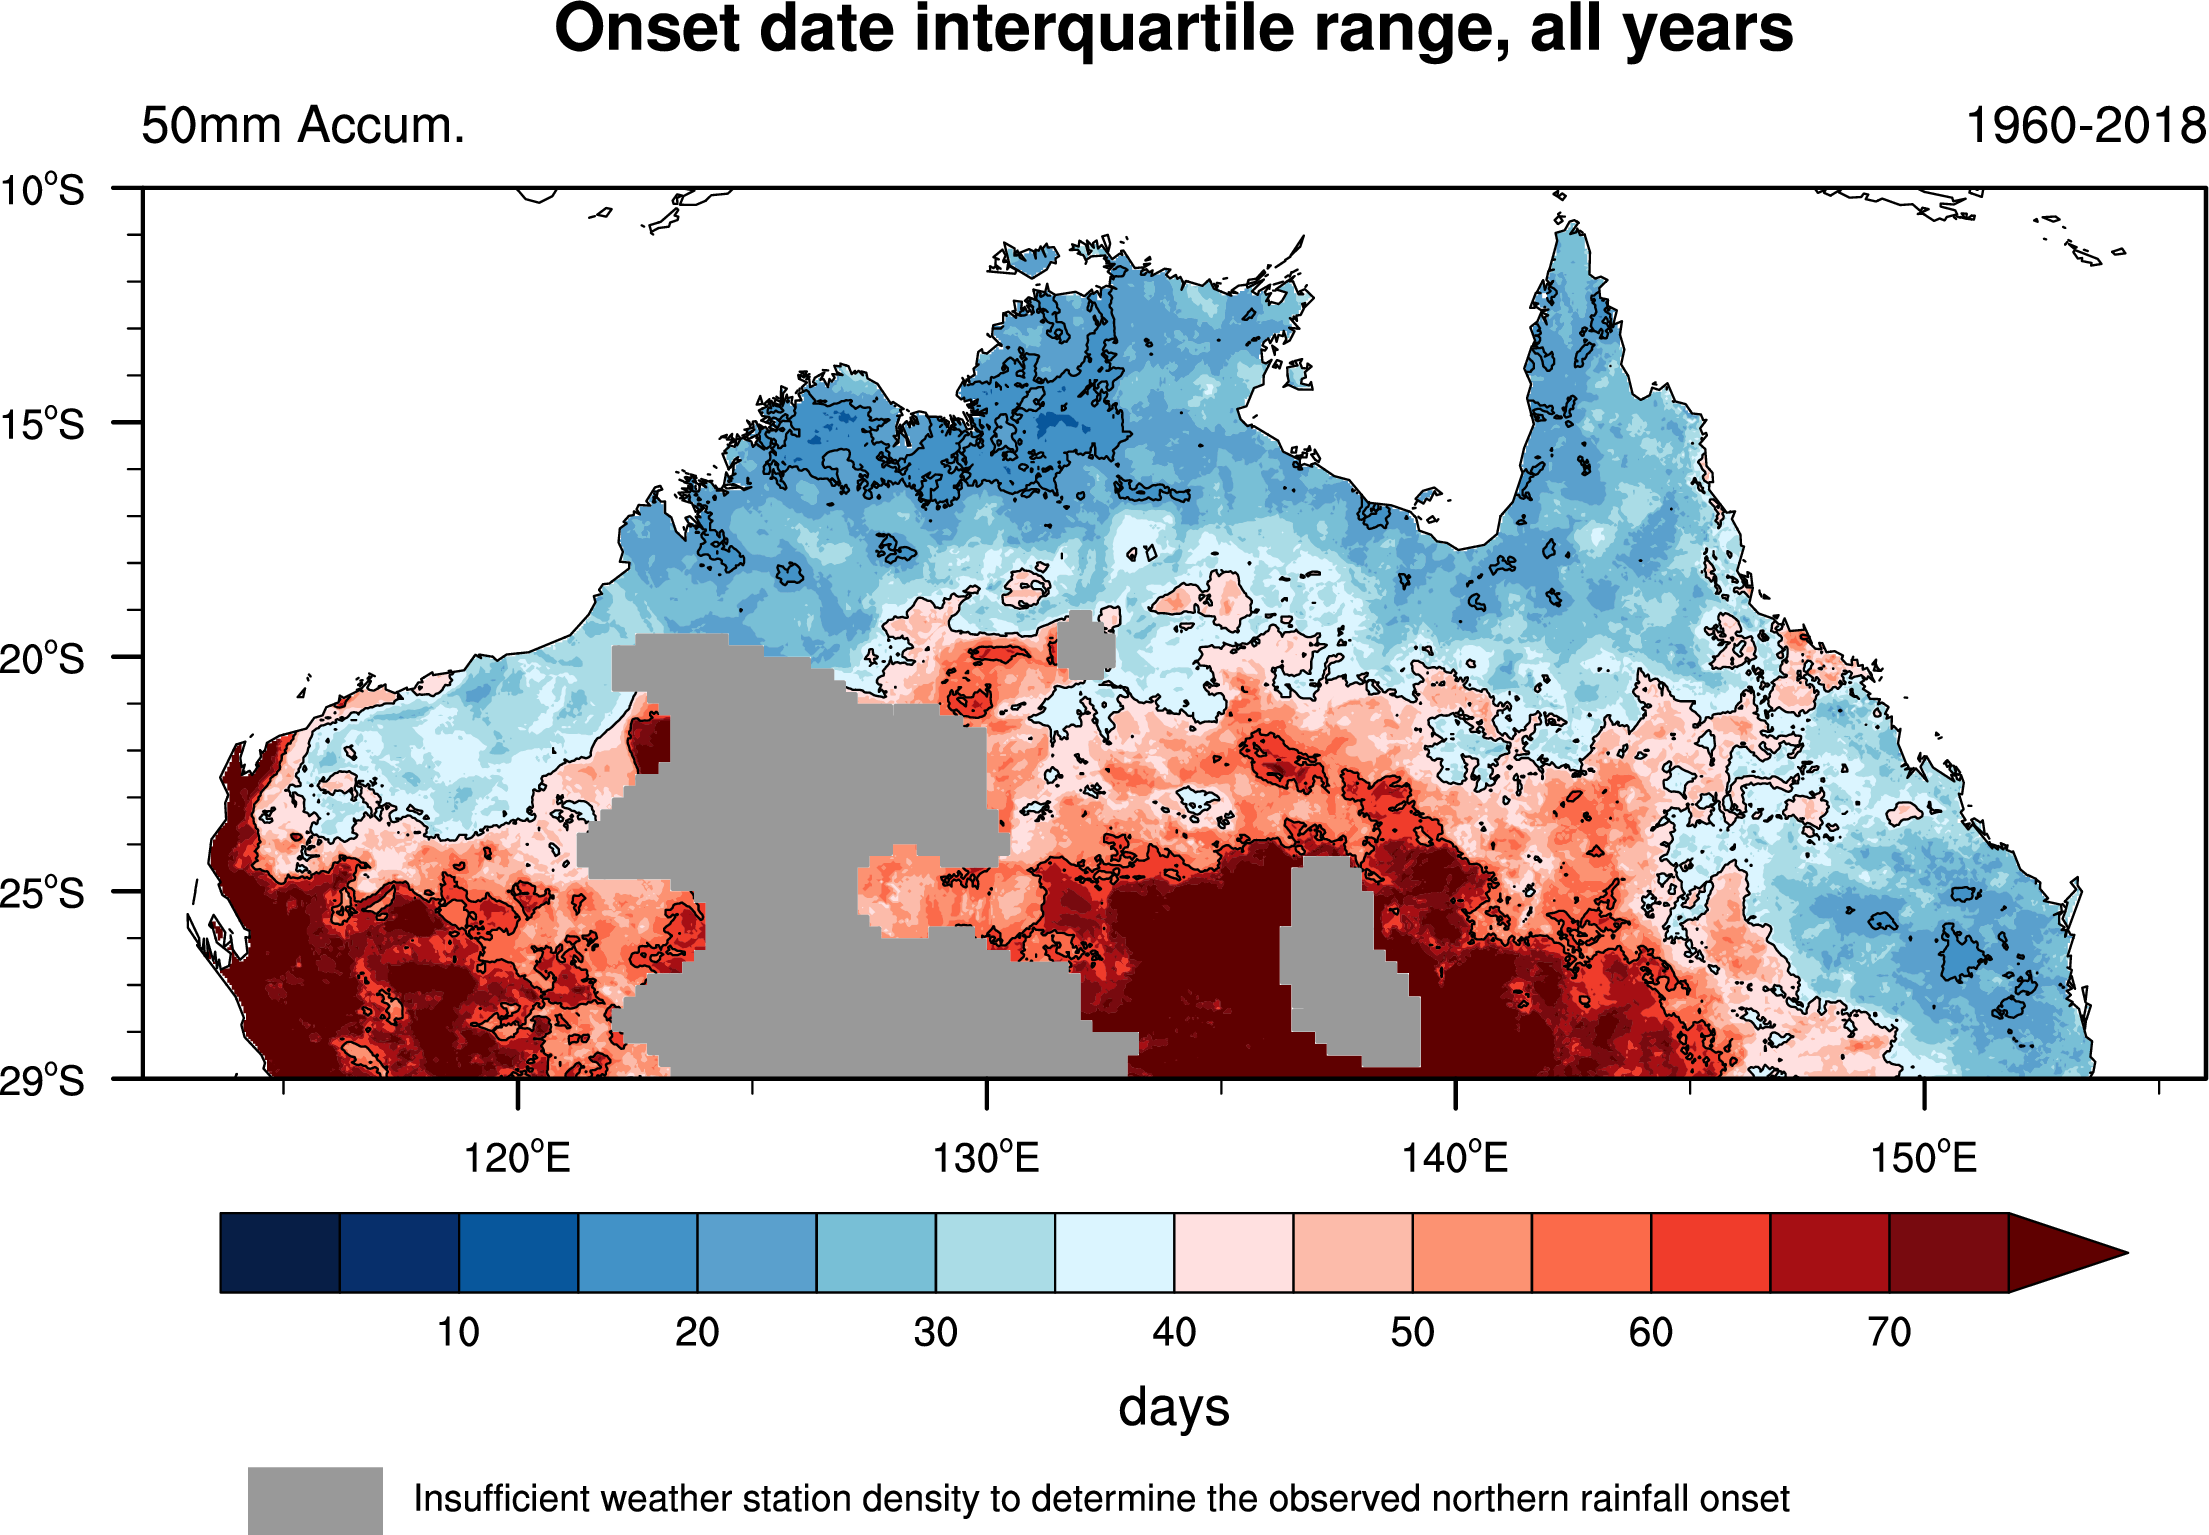
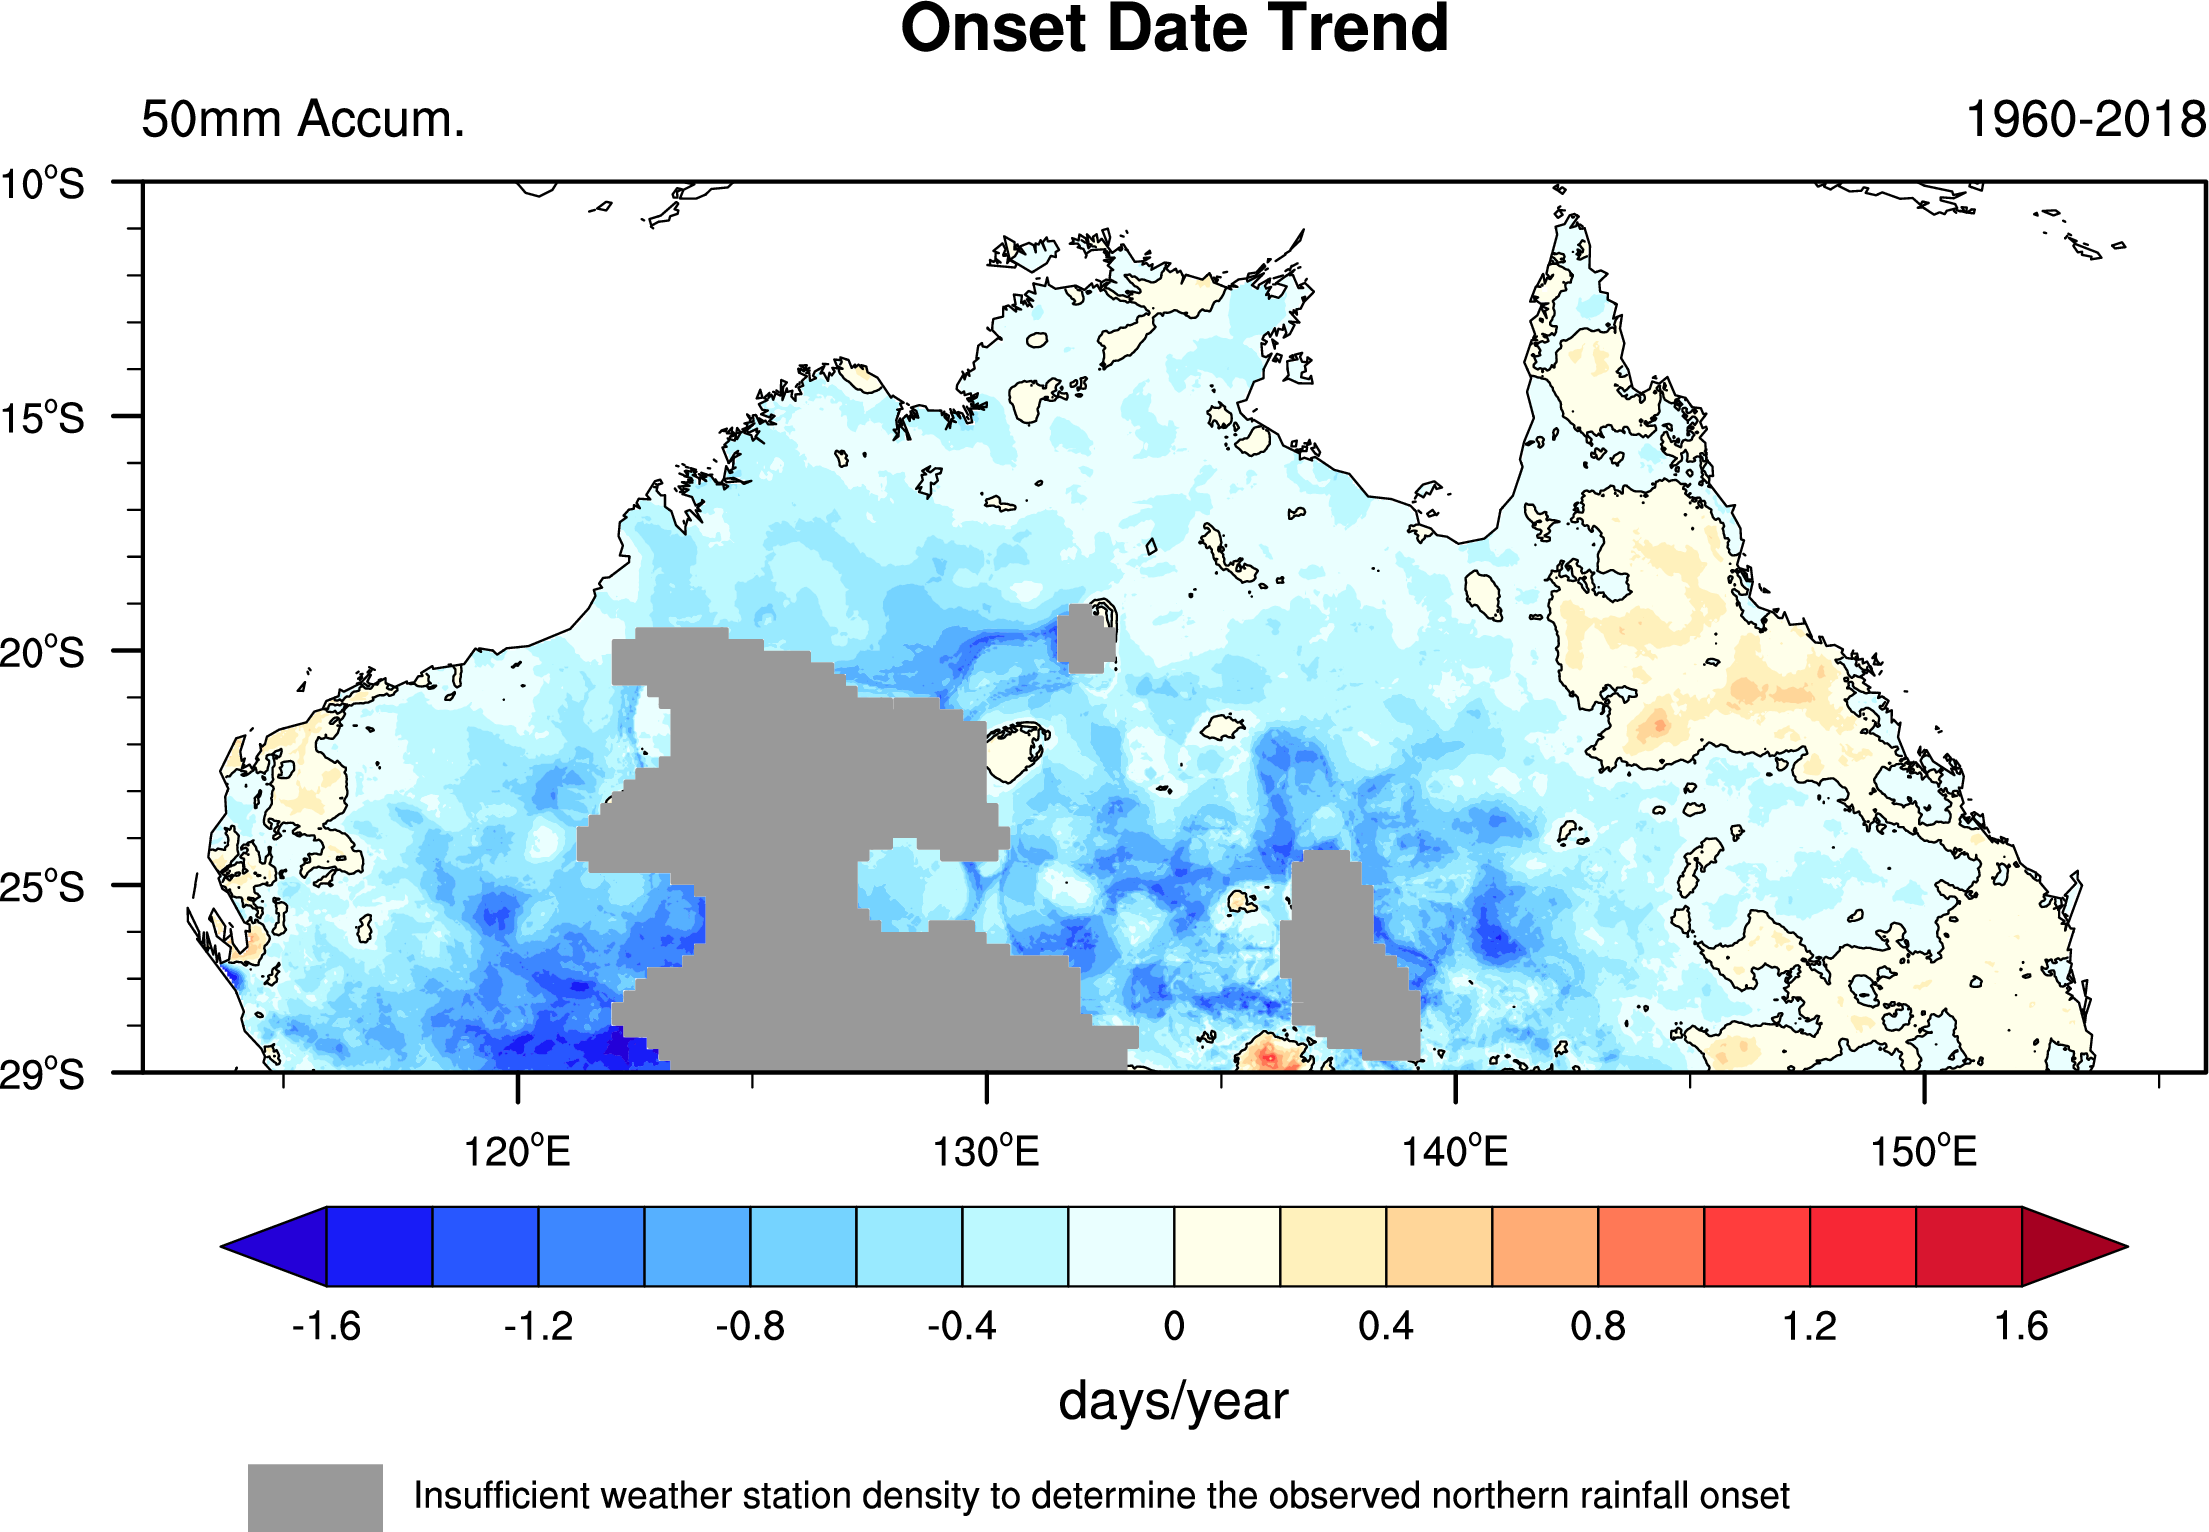
The left panel displays the onset date interquartile range for all years, calculated as the difference between the upper and lower quartiles. It shows there is significant inter-annual variability in the onset, and skillful predictions of this can be very valuable. The right panel displays the onset date trend over a selection of periods ; for the period 1960-2018, there is a significant trend towards earlier onset over the interior of Western Australia and the southern regions of the Northern Territory. Across Central Australia, the onset trend is ~-1 day per year, equivalent to the onset occurring ~60 days earlier in the later years.
