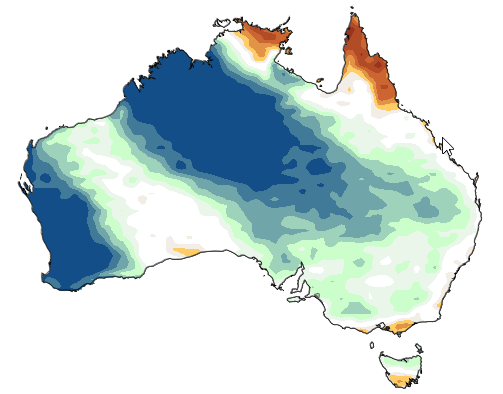
The ACCESS-S2 Skill Viewer displays maps of grided forecast skill for ACCESS-S2, the Bureau of Meteorology's seasonal-to-subseasonal ensemble prediction system. "Skill" means how much better (or worse) an ACCESS-S2 forecast is than a simple climatological reference forecast, when both are compared against observations over the 1981-2018 hindcast period. The hindcasts are 27-member, time-lagged ensembles initialised at the start of every calendar month over 1981-2018: there is a "seasonal" set (forecasts out to 8 months) and a "subseasonal/multi-week" set (forecasts out to 5 weeks ahead).
Skill plots (password protected) can be viewed at
Observational datasets
Two different "truth" datasets are used, depending on treatment:
| Treatment | Observations used |
|---|---|
| Calibrated (5 km, downscaled) | Australian Gridded Climate Data (AGCD), a gridded analysis of station observations over the Australian continent. The ACCESS-S2 "calibrated" forecasts have been statistically bias-corrected and downscaled to this grid. |
| Raw (60 km) | The ERA5 reanalysis, regridded onto the native global ACCESS-S2 model grid. ERA5 is not a direct observational dataset - it is a reanalysis that blends a dynamical atmospheric model with data assimilation to reconstruct the historical atmosphere. |
Plot controls
| Control | Description |
|---|---|
| Date | The forecast start (initialisation) date, e.g. 0101, 0701. |
| Treatment | Calibrated or Raw. See Observational datasets above. |
| Region | Domain shown: Australia, or Australia and Tropics. |
| Metric | The skill score being mapped - e.g. RMSE skill score, Brier Skill Score, Weighted Percent Correct. See Skill metrics. |
| Variable | Maximum/minimum temperature (tasmax/tasmin), precipitation (pr), solar radiation (rsds), daily average wind speed (wndsp av) or wind speed at 06Z (wndsp 06Z). |
| Aggregation | Whether the plot uses a single start month, or pools several adjacent start months together to increase the sample size and reduce sampling noise. |
| Forecast period | The averaging period: weekly, fortnightly, monthly or seasonal (3-month) means, at successive lead times (e.g. "month 1", "months 2-4"). |
Metrics fall into two groups:
- deterministic metrics using only the ensemble mean forecast.
- probabilistic metrics using the full ensemble.
\[ \text{Skill Score} = 1 - \frac{S_{\text{ACCESS-S2}}}{S_{\text{reference}}} \]
Values above zero mean ACCESS-S2 beats climatology, with a maximum of 1 (100%) for a perfect forecast.
Deterministic metrics (ensemble mean)
| Metric | Definition |
|---|---|
| Mean Absolute Error (MAE) | \( MAE = \overline{|\,\text{forecast} - \text{observation}\,|} \), averaged over hindcast years, reported as a skill score relative to a climatological forecast. |
| Root Mean Square Error (RMSE) | \( RMSE = \sqrt{\overline{(\text{forecast} - \text{observation})^2}} \). The reference RMSE equals the standard deviation of the observed anomalies, so the RMSE skill score measures the fraction of observed variability explained by the forecast. |
| Anomaly Correlation Coefficient (ACC) | Correlation between forecast and observed anomalies from climatology, ranging from -1 to 1. Shown directly, not relative to a reference. |
| Standard Deviation ratio (SD) | Ratio of forecast to observed standard deviation. Not a skill score - indicates whether the forecast under- or over-disperses relative to reality. |
Probabilistic metrics (full ensemble)
| Metric | Definition |
|---|---|
| Continuous Ranked Probability Score (CRPS) | Generalises the MAE to probabilistic (ensemble) forecasts, scoring the full ensemble distribution
against the observation, via the NCI scores
package. Reported as a skill score relative to a climatological ensemble. |
| Brier Skill Score (BSS) | For a threshold-exceedance event (e.g. "above median", "top tercile"), the forecast probability \(p\) (fraction of ensemble members exceeding the threshold) is scored against the binary observed outcome \(o\) using the Brier Score, \( BS = \overline{(p - o)^2} \). The reference uses the best constant-probability climatological forecast. Reported as \(BSS = 1 - BS/BS_{\text{ref}}\). |
| (Weighted) Percent Correct | A contingency-table metric for the above/below median forecast. Each hindcast year is classified as a hit, correct rejection, miss or false alarm. Percent Correct is the percentage of hits + correct rejections. Weighted Percent Correct (WPC) instead weights each year by the size of the observed anomaly, so a strongly anomalous season counts more than a near-average one: \[ WPC = \frac{\sum \left(\text{(hit or correct rejection)} \times |\text{observed anomaly}|\right)} {\sum |\text{observed anomaly}|} \times 100\% \] A random or constant-probability forecast scores 50% on average. WPC is the metric shown on the Bureau's public seasonal outlook maps (see Wang et al. 2019). |
With only 38 hindcast years, skill score estimates are noisy. Areas on each map that are hatched indicate that the difference between the ACCESS-S2 and reference forecast scores is not statistically significant at the \(p = 0.05\) level. This statistical significance is calculated differently depending on the metric.
- MAE, RMSE, CRPS, ACC, Brier Score: a one-sided Student's t-test on the paired, per-year difference between the ACCESS-S2 and reference score time series. Where results are pooled across several adjacent start months (aggregation), the effective sample size is adjusted downwards to account for the resulting autocorrelation (see Holmes et al. 2026, in review).
- Percent Correct: a one-sided binomial test, since the number of "correct" hindcast years under a no-skill forecast follows a Binomial(\(N\), 0.5) distribution.
- Weighted Percent Correct: cannot be decomposed into independent per-year contributions, so significance is assessed by bootstrap resampling over hindcast years, testing whether the metric is significantly above its no-skill benchmark (50%).
See Gneiting and Katzfuss (2014), Probabilistic Forecasting, for more background on forecast verification, including the assumption that different hindcast years are statistically independent.
- Hudson et al. (2017), ACCESS-S1: The new Bureau of Meteorology multi-week to seasonal prediction system.
- Wedd et al. (2022), ACCESS-S2: the upgraded Bureau of Meteorology multi-week to seasonal prediction system.
- Griffiths et al. (2023), ACCESS-S2: Updates and improvements to post processing pipeline.
- Wang et al. (2019), A user-oriented forecast verification metric: Weighted Percent Correct, Meteorologische Zeitschrift, 28, 193-202.
- Gneiting and Katzfuss (2014), Probabilistic forecasting, Annual Review of Statistics and Its Application.
- NCI
scorespackage, used for the CRPS calculation. - The code used to produce these verification plots is available on request, including two worked tutorial notebooks that walk through every metric and significance test in detail.
Contact
These pages are maintained by the Seasonal and Marine Applications Team, Research, Science and Innovation Group (SIG), Bureau of Meteorology.
Plots are password protected. For login details or other information please contact S2 Skill Verification Team.
The following conditions apply:
- Products are not official Bureau products, they are prototype products
- Products are only to be used for trial purposes to assess their usefulness and not as an ongoing service
- Products are not operationally supported, they may occasionally be unavailable for periods of up to 2 weeks e.g., due to system upgrades
- The look and feel of products may change at any stage without notice
- Products may be added and removed at any stage without notice